Introduction
Keeping an eye on who’s trying to attack your servers can be invaluable for sysadmins, self-hosters, and homelab enthusiasts. In this guide, I’ll set up a low-code, open-source cyber threat monitoring stack using CrowdSec (as the intrusion detection engine), VictoriaMetrics (as a time-series database for metrics), and Grafana (as the visualization layer). This combination provides rich real-time insights into attacks on your infrastructure – for example, you can see which countries and networks (ASNs) most of your attackers come from, what attack scenarios (SSH brute-force, web exploits, etc.) are being triggered, and how many threats are being blocked over time. By leveraging these tools, you get the kind of cyber threat statistics that default CrowdSec metrics alone don’t provide – all in a visual dashboard.
The process outlined here was deeply inspired by the article “Cyber threat insights with CrowdSec, VictoriaMetrics and Grafana” and the Grafana dashboard “CrowdSec Cyber Threat Insights” available on Grafana’s website. My goal is to document the end-to-end setup so that you can replicate it on your own infrastructure. I will use three servers or containers: one running CrowdSec (on the machine we want to monitor/protect), one running VictoriaMetrics (to store metrics pushed from CrowdSec), and one running Grafana (to query VictoriaMetrics and display dashboards).
Why this setup? It allows you to maintain full control over your data and get actionable, real-time intelligence on attacks. Instead of relying on CrowdSec’s cloud Console for insights or its limited built-in Prometheus metrics (which lack detailed threat context), you can self-host an equivalent solution. The Grafana dashboard will highlight things like top attacker countries, a world map of threat origins, the most frequent attack scenarios hitting your systems, and more – giving you a clear visual overview of your “threat landscape” at a glance.
In the following sections, I’ll walk through the setup step by step, from installing each component to configuring CrowdSec to push data into VictoriaMetrics and finally viewing the results in Grafana. Let’s get started!
Architecture Overview
Before diving in, here’s a quick overview of how the pieces work together:
- CrowdSec (Security Engine) – Runs on the server you want to monitor. It analyzes logs and detects malicious behavior (e.g. SSH brute force, port scans), and generates decisions (such as bans). We will configure CrowdSec to send these decisions as metrics to VictoriaMetrics using its HTTP notification plugin.
- VictoriaMetrics (Metrics Store) – A high-performance time-series database (compatible with Prometheus API) that will ingest metrics from CrowdSec. CrowdSec will push data to VictoriaMetrics’s HTTP API endpoint (
/api/v1/import), effectively logging each security decision as a metric data point.
- Grafana (Visualization Dashboard) – Queries the metrics from VictoriaMetrics and displays them in a dashboard. We will use a pre-built Grafana dashboard (ID
21689) tailored for CrowdSec threat insights, which expects the metrics we’re sending (likecs_lapi_decisionevents). Grafana’s interface will allow filtering, exploring, and visualizing the CrowdSec data over time.
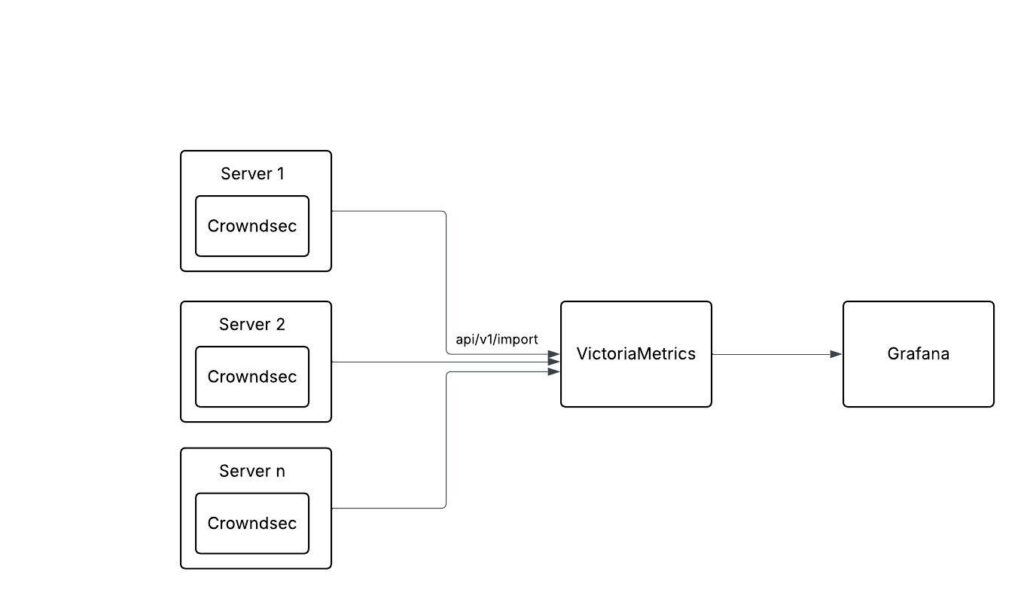
These components communicate as follows: CrowdSec (on each protected host) → HTTP push → VictoriaMetrics (central metrics DB) → PromQL queries → Grafana (dashboard for analysis). This decoupled design means you can monitor multiple CrowdSec-protected machines by pointing them all to a single VictoriaMetrics instance if desired:
Step 1: Install and Run VictoriaMetrics (Metrics Storage)
First, set up the VictoriaMetrics server, which will collect and store the security events from CrowdSec. We’ll use Docker to keep things simple (you can also use a binary or system package if you prefer):
- Run the VictoriaMetrics container – On your designated metrics server, run:
docker run -d --name victoriametrics -p 8428:8428 victoriametrics/victoriametrics
This pulls the latest VictoriaMetrics single-node image and exposes it on port 8428 (the default port for VictoriaMetrics HTTP API and UI). In a few seconds, the service should be up and listening. - Verify it’s running – You can confirm by visiting
http://<VM_server_IP>:8428in a browser. VictoriaMetrics provides a built-in web UI (at/vmui) for queries and status. If all is well, you should see a page titled “VMUI” or similar. Another quick check is runningdocker logs victoriametricsto see if it started without errors. - (Optional) Persist Data – By default, the above run command stores data in the container. For a real deployment, you might want to mount a volume for
/victoria-metrics-datato preserve data across restarts. For this guide, we’ll assume a simple ephemeral setup is fine.
VictoriaMetrics doesn’t require much initial configuration – it’s ready to receive data. We’ll proceed to set up Grafana next, then come back to configuring CrowdSec to push metrics here.
Step 2: Install Grafana (Visualization Layer)
Next, we’ll set up Grafana to visualize the data. You can either use Docker (quick for testing) or install it on a Linux server (Debian/Ubuntu) directly. I’ll outline both approaches:
- Option A: Docker – On the Grafana server, run:
docker run -d --name grafana -p 3000:3000 grafana/grafana-oss
This will start a Grafana instance on port 3000. Log in by visitinghttp://<Grafana_server_IP>:3000(the default login is admin/admin, which you’ll be prompted to change). - Option B: Native Install (Debian/Ubuntu) – Grafana provides .deb packages and APT repository. In short, you would add Grafana’s GPG key and repository, then install the package. For example, on Ubuntu/Debian:
sudo apt-get install -y apt-transport-https software-properties-common
wget -q -O - https://packages.grafana.com/gpg.key | sudo apt-key add -
sudo add-apt-repository "deb https://packages.grafana.com/oss/deb stable main"
sudo apt-get update && sudo apt-get install -y grafana
sudo systemctl enable --now grafana-server
This installs Grafana and starts the service on port 3000. Access it via browser as above.
Add VictoriaMetrics as a Data Source: Once Grafana is running, we need to connect it to VictoriaMetrics as a data source. Grafana treats VictoriaMetrics like a Prometheus data source (since VictoriaMetrics supports the PromQL API). In Grafana’s web UI:
- Log in and go to Configuration → Data Sources → Add data source.
- Select Prometheus as the data source type.
- Set the URL to your VictoriaMetrics instance. For example:
http://<VM_server_IP>:8428(use the host/IP where VM is running, port 8428). Note: You do not need to add/api/v1in the URL – Grafana will handle the proper endpoints. - Click Save & Test. Grafana should confirm that the data source is working (it will perform a test query). If successful, you’re ready to use VictoriaMetrics data in Grafana.
At this point, Grafana is set up and knows how to query VictoriaMetrics. Now we’ll import the pre-built dashboard for CrowdSec data.
Step 3: Import the CrowdSec Cyber Threat Insights Dashboard
Grafana allows importing dashboards that others have created. The dashboard we want to use is “Crowdsec Cyber Threat Insights” (available on Grafana’s community dashboards site, ID 21689). This dashboard was specifically created to visualize CrowdSec metrics in VictoriaMetrics. It includes charts and tables for things like “Cyberthreats Over Last Month”, “Top 10 Cyberthreat Countries”, a world map of threat origins, and real-time lists of recent attacks/decisions.
To import the dashboard: In Grafana UI, go to Plus (+) icon → Import. Then either:
- Enter the dashboard ID
21689and click “Load”, or - Paste the URL:
https://grafana.com/grafana/dashboards/21689-crowdsec-cyber-threat-insightsand click “Load”, or - Download the JSON from Grafana’s site and upload it.
Grafana will then ask you to select the data source for the dashboard’s queries. Choose the VictoriaMetrics/Prometheus data source you added in the previous step (e.g. “Prometheus – http://:8428”). Complete the import, and Grafana will add the dashboard to your list.
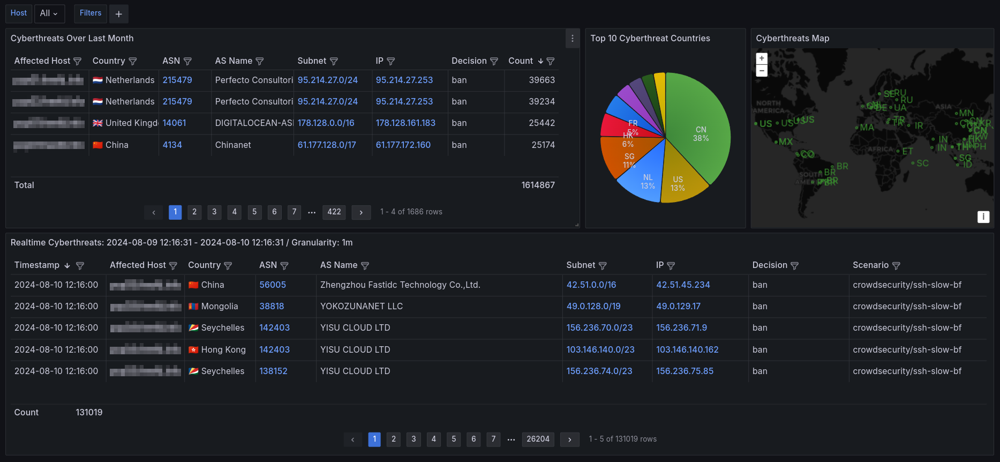
Now, when you open the CrowdSec Cyber Threat Insights dashboard, it may be mostly empty (since we haven’t fed any data yet). But you should see the layout of panels. For example, the top section has a table of “Affected Hosts” and counts of attacks over the last month, a pie chart of top attacker countries, and a world map of cyberthreats. Lower down, there’s a “Realtime Cyberthreats” table listing recent decisions (with columns like timestamp, country, IP, decision action, scenario), and some stats like total count of events. This dashboard is quite comprehensive – it even has interactive filters (you can click on a country in the pie chart to filter the whole dashboard for that country, etc.). We’ll see it in action once data is flowing.
Example Grafana dashboard view (CrowdSec Cyber Threat Insights) – once data is ingested, you’ll see panels showing top attacker countries, a world map of attack sources, recent attack logs, etc., all derived from CrowdSec metrics. (This dashboard comes from Grafana Labs ID 21689.)
At this stage, Grafana and VictoriaMetrics are ready. The remaining work is to install CrowdSec on the target server and configure it to push its decisions to VictoriaMetrics.
Step 4: Install and Enroll CrowdSec on the Monitored Server
Now we set up CrowdSec on the server that we want to monitor (this could be a public-facing VPS, a local server, etc. – anywhere you have logs of services and want to detect attacks). If you already have CrowdSec running on your server, you can skip the installation steps and move to configuration.
Install CrowdSec: The CrowdSec team provides packages for easy installation. On a Debian/Ubuntu system, you can enable the CrowdSec repository and install it via APT. For example:
# Add CrowdSec repository (via packagecloud script)
curl -s https://packagecloud.io/install/repositories/crowdsec/crowdsec/script.deb.sh | sudo bash

# Install CrowdSec
sudo apt install crowdsec
Within a minute or two, CrowdSec should be installed and running as a system service (it starts automatically). You can verify by checking the service status: systemctl status crowdsec (look for “active (running)”). By default, CrowdSec will start parsing logs and detecting common attack scenarios (the installation comes with a “base collection” of parsers and scenarios for SSH, web servers, etc., and uses a local SQLite database to store decisions).
Enroll in CrowdSec Console (optional): CrowdSec has a centralized Console (dashboard) and community blocklist sharing. Enrolling your instance with the CrowdSec Console isn’t strictly required for our monitoring setup, but it is recommended if you want to contribute to/benefit from CrowdSec’s community threat intelligence. To enroll, you would create an account on app.crowdsec.net (if you haven’t already) and retrieve an enrollment key. Then on your server, run a command like sudo cscli console enroll <your_enrollment_key>. This will register your CrowdSec instance with your Console account. (If you skip this, your CrowdSec still works locally, you just won’t see it in the CrowdSec web Console – which is fine for our purposes.)
At this point, CrowdSec is running and detecting attacks on your server. It’s likely already banning some IPs (decisions) if, for example, you have an SSH server and someone is hammering it. However, by default CrowdSec’s notification output is minimal – it won’t automatically send these events to our VictoriaMetrics. We need to configure CrowdSec’s notification plugin to forward decisions to our metrics store. We’ll do that next.
Step 5: Configure CrowdSec to Push Metrics to VictoriaMetrics
This is the most critical part – we’ll set up CrowdSec’s HTTP notification plugin so that every time CrowdSec generates a new decision (e.g. bans an IP), it sends a JSON payload describing that decision to VictoriaMetrics. VictoriaMetrics will ingest these as time-series data points. The Grafana dashboard we imported is built to query and display those points.
CrowdSec’s notification system is configured via two files: profiles.yaml (which controls when to send notifications and to which plugin) and an HTTP plugin config (which controls how and where to send them). We will modify/add to these files.
- Enable the HTTP notification in profiles: Open CrowdSec’s profiles configuration, typically at
/etc/crowdsec/profiles.yaml. Find the section fornotifications. By default, you might see an example that is commented out. We need to ensure there is a notification entry for our HTTP plugin. For example, inprofiles.yamlyou can add (or uncomment) lines under the appropriate profile to includehttp_defaultas a notification channel. I’ve been tangling around with my setup and ended up with:name: default_ip_remediationfilters:
–Alert.Remediation == true && Alert.GetScope() == "Ip"decisions:
–type: ban
–duration: 4hnotifications:
–http_defaulton_success: break
(Note: I have trouble with above formatting. Ensure that it's valid yaml!)
This tells CrowdSec to use the notification plugin named “http_default” for alerts that match this profile. In the default CrowdSec configuration, the last profile usually matches all alerts/decisions, so adding http_default there will make sure every decision triggers our HTTP plugin. (If you installed CrowdSec fresh, there may already be an http_default notification in profiles.yaml that’s just commented out – simply remove the # to enable it or use mine as above).
2. Configure the HTTP plugin (http.yaml): Now edit the file /etc/crowdsec/notifications/http.yaml. If it doesn’t exist, create it. This is where we define the HTTP request that CrowdSec will make for each alert/decision. We will set it up to call VictoriaMetrics. A minimal configuration for our purpose will look like:
type: http
name: http_default
method: POST
url: http://<Victoriametrics_IP>:8428/api/v1/import
headers:
  Content-Type: application/json
#  Authorization: "Basic <base64encodedcreds>"   # (not needed unless VM requires auth)
format: >
  {{- range $alert := . -}}
  {{- range .Decisions -}}
  {"metric":{"__name__":"cs_lapi_decision",
             "instance":"<YOUR_INSTANCE_NAME>",
             "country":"{{$alert.Source.Cn}}",
             "asname":"{{$alert.Source.AsName}}",
             "asnumber":"{{$alert.Source.AsNumber}}",
             "latitude":"{{$alert.Source.Latitude}}",
             "longitude":"{{$alert.Source.Longitude}}",
             "iprange":"{{$alert.Source.Range}}",
             "scenario":"{{.Scenario}}",
             "type":"{{.Type}}",
             "scope":"{{.Scope}}",
             "ip":"{{.Value}}"
            },
   "values":[1],
   "timestamps":[{{now|unixEpoch}}000]}
  {{- end }}
  {{- end -}}
Let’s break down what’s happening here:
- type/name: We define an HTTP type notification named
http_default(the name must match what we put in profiles.yaml). - url: This is the endpoint to send data to. We use VictoriaMetrics’s
/api/v1/importHTTP endpoint. Replace<Victoriametrics_IP>with the address (or hostname) of your VM server. If VictoriaMetrics uses a different port or HTTPS, adjust accordingly. (For a local test where CrowdSec and VM are on the same machine, you could usehttp://localhost:8428/api/v1/import.) - headers: We set
Content-Type: application/jsonbecause we’ll send JSON. We leave out authorization since our VM instance isn’t behind auth. If you secured your VictoriaMetrics with basic auth or an API token, you’d include anAuthorizationheader here. Otherwise, make sure to remove or comment out theAuthorizationline entirely. - format: This is a Go template that produces the JSON payload. It iterates over each alert and each decision in that alert (usually one alert contains one decision in our context) and formats a JSON object. The JSON is structured in a way VictoriaMetrics expects for the import API (essentially in JSON Lines format, one metric per line). In the above template:
"__name__": "cs_lapi_decision"sets the metric name for all events. We usecs_lapi_decisionas the metric name (short for “CrowdSec Local API decision”). This is the same metric name the Grafana dashboard expects."instance": "<YOUR_INSTANCE_NAME>"is a label to identify which server this data came from – you can put anything like"web01"or a hostname here. For example, in the template from the inspiration article it’s set tohost00.domain.tld. Use a value that makes sense for you (especially if you will have multiple servers sending to one VM).- The other fields like
country,asname,asnumber, etc. are grabbing information from CrowdSec’s alert object ($alert.Source). CrowdSec enriches alerts with GeoIP and ASN info, so these will include the country code, the ISP/organization name, the AS number of the source IP, latitude/longitude, and the IP range (prefix) if available. Similarly,scenariois the CrowdSec scenario that triggered (e.g.crowdsecurity/ssh-bf),typewill usually be “ban” (or challenge, etc.),scopeis typically “Ip”, andipis the malicious IP address itself. All these become labels on the metric. - We set
"values": [1]and a timestamp (epoch in milliseconds) for each decision. Using a value of 1 for each event is a simple trick: it means each record contributes a count of 1. This way, when Grafana visualizes the data, it can count events, sum them, etc., treating them as time-series occurrences.
The end result is that every decision (ban) from CrowdSec will generate a metric data point named cs_lapi_decision{instance="X", country="Y", scenario="Z", ...} = 1. In VictoriaMetrics, if you query this metric you’ll be able to filter and aggregate by these labels – which is exactly what our Grafana dashboard does.
3. Apply the configuration: Once you have updated profiles.yaml and http.yaml, save the files. Double-check that:
- In
profiles.yaml, thehttp_defaultnotification is uncommented and in the right place (under the profile that should trigger on decisions). - In
http.yaml, the placeholders have been replaced with real values (your VM URL, an instance name, etc.), and there are no syntax errors (YAML spacing matters). If you copied the template, ensure the indentations are correct.
4. Restart CrowdSec: For the changes to take effect, restart the CrowdSec service. On Linux: sudo systemctl restart crowdsec. This will cause CrowdSec to load the new notification configuration. You can check CrowdSec’s log (/var/log/crowdsec.log) to see if it mentions loading the HTTP plugin without errors.
After restart, CrowdSec will now attempt to send an HTTP POST to VictoriaMetrics for every new decision. To ensure it’s working, we should test it with a sample event.
Step 6: Testing the Integration (Verifying Data Flow)
With everything in place, it’s time to test whether our pipeline works: CrowdSec → VictoriaMetrics → Grafana.
Trigger a test decision: The easiest way to do this is to manually add a ban through CrowdSec. This simulates a detected threat. We can use CrowdSec’s command-line tool (cscli) to insert a decision. For example, on the CrowdSec server run:
sudo cscli decisions add --ip 1.2.3.4 --duration 4h --reason "test-scenario" --scope IpReplace 1.2.3.4 with any IP of your choice (perhaps your own IP or a dummy). This command tells CrowdSec to treat 1.2.3.4 as if it was detected attacking and to ban it for 4 hours, with a reason label of “test-scenario”. When you execute this, CrowdSec will create a new decision internallydocs.crowdsec.net. Importantly, because we enabled the HTTP notification, it should immediately send our JSON payload to VictoriaMetrics.
Check VictoriaMetrics: To confirm VictoriaMetrics received the data, you can query it. If you still have the VictoriaMetrics UI open (http://<VM_server>:8428/vmui), try running a query for the metric name. In the VM UI’s query box, enter:
cs_lapi_decision[1h]and execute it (you might set a time range to the last 5 minutes to narrow it). If everything worked, you should see at least one data point. You can also query with a filter, for example:
cs_lapi_decision{ip="1.2.3.4"}[5m]to specifically look for the metric with the IP label you added. In the VM UI’s JSON tab, you’d see an output confirming the data, e.g. something like:
[
  {
    "metric": {
      "__name__": "cs_lapi_decision",
      "instance": "web01",
      "country": "??",
      "asname": "<ASN name>",
      "asnumber": "<ASN number>",
      "scenario": "test-scenario",
      "type": "ban",
      "scope": "Ip",
      "ip": "1.2.3.4"
    },
    "values": [ 1 ],
    "timestamps": [ 1692873600000 ]
  }
]
The exact labels will vary; for a private IP or an IP not in the GeoIP database, country might be empty or ??. If you used a real public IP, CrowdSec’s GeoIP enrichment should have filled in the country, ASN, etc., which would show up here. The key is that we have a cs_lapi_decision data point in VictoriaMetrics.
Check Grafana Dashboard: Now head back to Grafana and view the imported CrowdSec Cyber Threat Insights dashboard. Make sure the time range at the top includes “Last 5 minutes” (or whichever interval covers the current time) and hit the refresh icon. You should start to see data appearing. For instance:
- The “Realtime Cyberthreats” table should now list the decision we added. It will show the timestamp, the Country (if resolved, or it might be blank if unknown), ASN info, the IP (
1.2.3.4), Decision (ban), and Scenario (test-scenario). This confirms that Grafana (via VictoriaMetrics) is receiving the data. - Other panels like “Top 10 Cyberthreat Countries” might not show much with just one event (or it might list an “unknown” country if that IP wasn’t resolved). As more events come in, those will populate.
- If the map or pie chart remains empty from a single test, don’t worry – those need a bit more data (e.g., at least one real geo-locatable IP). You can repeat the test with a couple of different IP addresses and reasons to generate sample points (for example, try one with
--ip 5.6.7.8 --reason "crowdsecurity/ssh-bf"to mimic an SSH brute-force scenario from another IP).
Over time, as CrowdSec runs and detects real attacks, this dashboard will become incredibly insightful. You’ll start seeing which hosts were attacked the most in the last month, which countries dominate your threat feed, and a scrollable list of all recent threats. Grafana’s interactive features (built into this dashboard) allow you to click on a country or ASN in the tables and filter the entire dashboard for that selection – so you can drill down on, say, “show me all attacks from China” with one click. There are also data links in some panels that can take you to external lookup tools (for example, clicking an ASN might offer a link to a regional internet registry lookup or CrowdSec’s Threat Intelligence search).
Using the VictoriaMetrics GUI and Grafana Explore: Besides the dashboard, remember that you can use VictoriaMetrics’s VMUI for ad-hoc queries (as we did) and Grafana’s Explore mode to query and inspect the data. This can be useful for troubleshooting or crafting custom queries. For instance, in Grafana Explore you could run a PromQL query like sum(rate(cs_lapi_decision[1h])) by (country) to see which countries have the most attacks in the last hour (assuming enough data). The combination of VMUI for quick JSON output and Grafana for graphing gives you a lot of flexibility to verify and analyze the metrics.
Conclusion
By integrating CrowdSec with VictoriaMetrics and Grafana, we’ve built a powerful monitoring solution that turns raw security events into meaningful visuals and stats in real time. This setup provides immediate situational awareness of your cyber threats: you can identify trends (e.g., a surge of SSH attacks from a particular country), see the impact of your defenses (which IPs got banned and when), and gain context on each attacker (via geoIP and ASN info). All of this is achieved with open-source tools running on your own servers, making it an attractive solution for those who prefer self-hosting and full data control.
Who benefits? If you’re a system administrator, a devops engineer, or a homelabber running internet-facing services, this integration gives you a “Threat Observatory” dashboard for your infrastructure. You’ll know, at a glance, what’s happening security-wise – something that typically required expensive SIEM solutions or managed services. Now you have actionable insights: for example, you might notice a spike in a particular attack scenario and decide to tighten a firewall rule, or you might use the data to report abuse to ISPs if you see repeated offenders.
Moreover, this setup complements CrowdSec’s prevention capabilities. CrowdSec will still block malicious IPs in real-time via bouncers (don’t forget to install a CrowdSec bouncer like the firewall bouncer, so that those “ban” decisions are enforced on your server). What our monitoring stack adds is the observability aspect – the ability to see and understand those security events at scale and historically.
don’t forget to install a CrowdSec bouncer like the firewall bouncer, so that those “ban” decisions are enforced on your server
In summary, we set up CrowdSec as the brain detecting threats, VictoriaMetrics as the memory storing those threat events, and Grafana as the eyes visualizing the patterns. With minimal configuration and using largely off-the-shelf components, we achieved a real-time cybersecurity insights dashboard. This empowers you to be proactive and informed about attacks on your systems. Happy monitoring, and may your logs forever be full of insightful data rather than uninvited guests!
References & Useful Links:
- CrowdSec Official Website – crowdsec.net (for documentation and Console access)
- VictoriaMetrics Official Docs – victoriametrics.com (for details on VM UI, API, etc.)
- Grafana Labs – grafana.com (for documentation on using Grafana, importing dashboards, etc.)
- Cyber threat insights with CrowdSec, VictoriaMetrics and Grafana (inspiration for this guide)
- CrowdSec documentation on HTTP notifications – docs.crowdsec.net (for advanced config and troubleshooting)
- Grafana Dashboard ID 21689: CrowdSec Cyber Threat Insights (available on Grafana Labs dashboards)
